Bend Municipal Watershed
The U.S. Forest Service requires special use permits, agreements and regular monitoring for any water used from the Bend Municipal Watershed.
The City of Bend is proud to provide clean, safe and reliable drinking water to our community. Our main source is fresh surface water from the Bend Municipal Watershed, which flows into our system using gravity. This efficient method helps us deliver high-quality water every day.
During the summer, when water use goes up—primarily for irrigation—we also rely on a second source: groundwater from the Deschutes Aquifer. This backup supply gives us extra security and helps meet the needs of our growing community.
Our water system is supported by long-standing agreements and special use permits, along with regular monitoring to make sure everything stays safe and up to standard. These efforts help protect the water we all depend on.
History of the Bend Municipal Watershed
This strong foundation didn’t happen overnight. Back in 1923, Bend faced a serious water problem. The Deschutes River, which was the main water source at the time, became polluted due to algae blooms in the reservoirs being built upstream. The private company then in charge—Bend Water Power and Light—struggled to navigate the complex legal, engineering and funding requirements needed to find a new water supply.
That’s when the City of Bend stepped in. With the support of the community, the City purchased the water system and created the Bend Municipal Watershed. Since 1926, we’ve worked closely with the U.S. Forest Service to protect and manage this vital resource.
Thanks to that partnership and the community’s commitment, we’ve been able to provide high-quality water for about a century now—and we’re still going strong.
Special Use Permit
The U.S. Forest Service requires special use permits, agreements and regular monitoring for any water used from the Bend Municipal Watershed.
Special Use Permit Monitoring Reports
- Tumalo Creek Measurements Station 1 – OWRD (#14070920)
- Tumalo Creek Measurements Station 2 – OWRD (#14070980)
- Tumalo Creek Temperature – Shevlin Park Rd
Prowell Springs Diversion
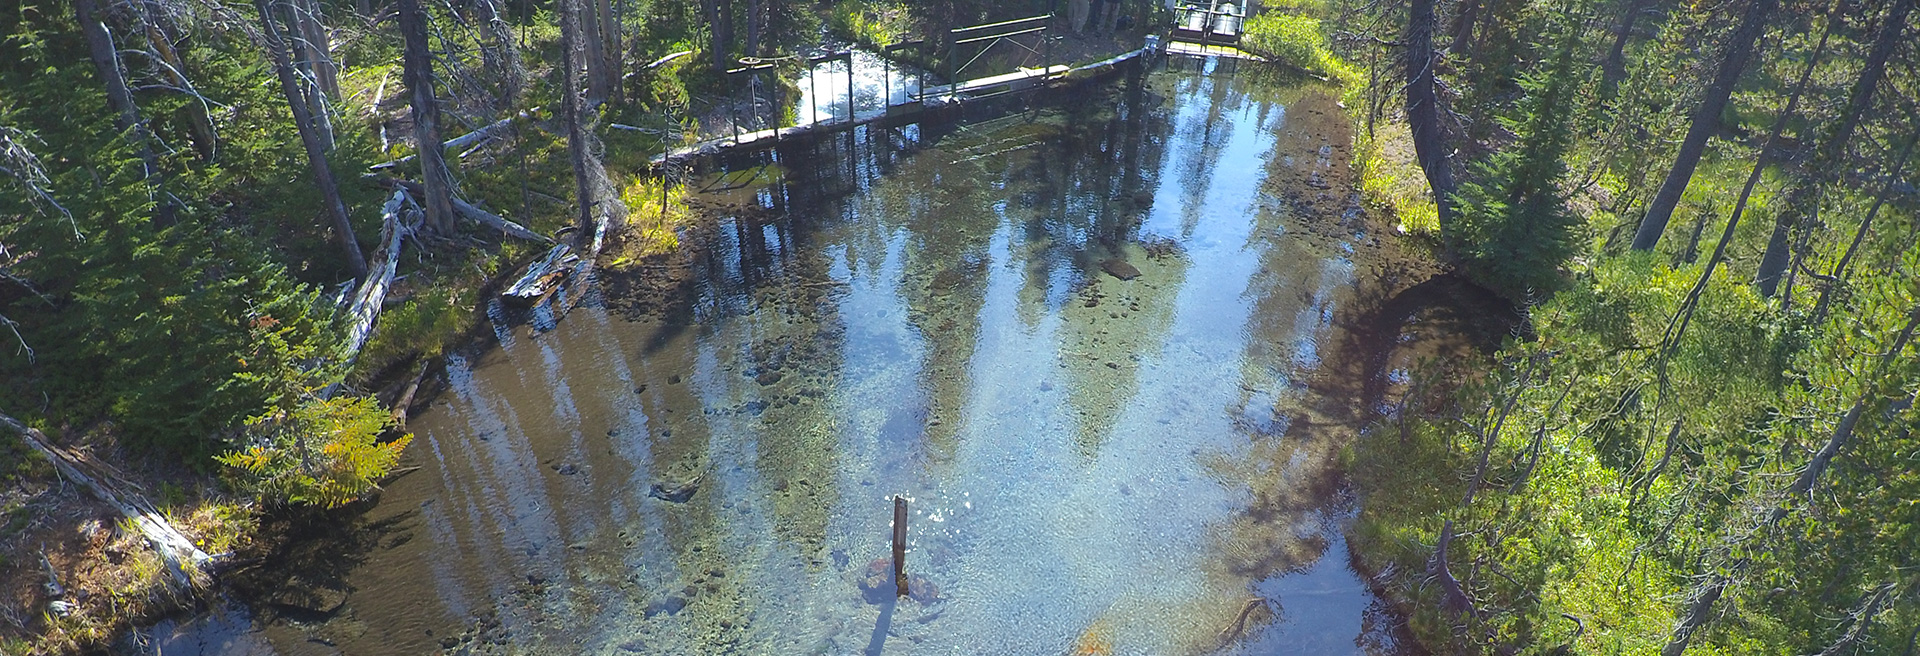
This is the location of the diversion structure that diverts spring flow into Bridge Creek, located high in the Bend Municipal Watershed at 6,300 feet. There are four gaging points that each include flow and temperature.
-
USGS 14070615 M F TUMALO CREEK ABV PROWELL SPRINGS, NR BEND, OR
https://waterdata.usgs.gov/or/nwis/uv/?site_no=14070615 -
USGS 14070624 M F TUMALO CREEK BLW PROWELL SPRINGS, NR BEND, OR
https://waterdata.usgs.gov/or/nwis/uv/?site_no=14070624 -
USGS 14070620 PROWELL SPRINGS DIVERSION POOL, NEAR BEND, OR
https://waterdata.usgs.gov/or/nwis/uv?site_no=14070620 -
USGS 14070621 DIVERSION CANAL TO BRIDGE CREEK, NEAR BEND, OR
https://waterdata.usgs.gov/or/nwis/uv/?site_no=14070621
Bridge Creek Intake
In addition to the diverted flow monitoring that is part of the special use permit data, this gaging station is designed to measure the flow and temperature going past the City of Bend intake on Bridge Creek, located about a quarter mile from the confluence with Tumalo Creek.
-
USGS 14070900 BRIDGE CREEK BELOW INTAKE, NEAR BEND, OR
LINK: https://waterdata.usgs.gov/or/nwis/uv/?site_no=14070900
- 2025 Stream Flow and Temperature Monitoring Report, USFS
- 2024 Stream Flow and Temperature Monitoring Report, USFS
- 2023 Stream Flow and Temperature Monitoring Report, USFS
- 2022 Stream Flow and Temperature Monitoring Report, USFS
- 2021 Stream Flow and Temperature Monitoring Report, USFS
- 2020 Stream Flow and Temperature Monitoring Report, USFS
- 2019 Stream Flow and Temperature Monitoring Report, USFS
- 2018 Stream Flow and Temperature Monitoring Report, USFS
- 2017 Stream Flow and Temperature Monitoring Report, USFS, Jason Gritzner
Surface Water Production Data
Surface Water Monthly Use Reports
MGD – Millions of gallons per day – 24 hour totals
2026
2025
- Jan 2025 – MGD
- Feb 2025 – MGD
- Mar 2025 – MGD
- Apr 2025 – MGD
- May 2025 – MGD
- Jun 2025 – MGD
- Jul 2025 – MGD
- Aug 2025 – MGD
- Sep 2025 – MGD
- Oct 2025 – MGD
- Nov 2025 – MGD
- Dec 2025 – MGD
2024
- Jan 2024 – MGD
- Feb 2024 – MGD
- Mar 2024 – MGD
- Apr 2024 – MGD
- May 2024 – MGD
- Jun 2024 – MGD
- Jul 2024 – MGD
- Aug 2024 – MGD
- Sep 2024 – MGD
- Oct 2024 – MGD
- Nov 2024 – MGD
- Dec 2024 – MGD
2023
- Jan 2023 – MGD
- Feb 2023 – MGD
- Mar 2023 – MGD
- Apr 2023 – MGD
- May 2023 – MGD
- Jun 2023 – MGD
- Jul 2023 – MGD
- Aug 2023 – MGD
- Sep 2023 – MGD
- Oct 2023 – MGD
- Nov 2023 – MGD
- Dec 2023 – MGD
2022
- Jan 2022 Report – MGD
- Feb 2022 – MGD
- Mar 2022 – MGD
- Apr 2022 – MGD
- May 2022 – MGD
- Jun 2022 – MGD
- Jul 2022 – MGD
- Aug 2022 – MGD
- Sep 2022 – MGD
- Oct 2022 – MGD
- Nov 2022 – MGD
- Dec 2022 – MGD
2021
- Jan 2021 Report – MGD
- Feb 2021 Report – MGD
- Mar 2021 Report – MGD
- Apr 2021 Report – MGD
- May 2021 Report – MGD
- Jun 2021 Report – MGD
- Jul 2021-Report – MGD
- Aug 2021 Report – MGD
- Sep 2021 Report _MGD
- Oct 2021 Report – MGD
- Nov 2021 Report – MGD
- Dec 2021 Report – MGD
2020
Surface Water Daily Use Reports
CFS – Hourly average flow rate in cubic feet per second (CFS) by month
2026
2025
- Jan 2025 – CFS
- Feb 2025 – CFS
- Mar 2025 – CFS
- Apr 2025 – CFS
- May 2025 – CFS
- Jun 2025 – CFS
- Jul 2025 – CFS
- Aug 2025 – CFS
- Sep 2025 – CFS
- Oct 2025 – CFS
- Nov 2025 – CFS
- Dec 2025 – CFS
2024
- Jan 2024 – CFS
- Feb 2024 – CFS
- Mar 2024 – CFS
- Apr 2024 – CFS
- May 2024 – CFS
- Jun 2024 – CFS
- Jul 2024 – CFS
- Aug 2024 – CFS
- Sep 2024 – CFS
- Oct 2024 – CFS
- Nov 2024 – CFS
- Dec 2024 – CFS
2023
- Jan 2023 – CFS
- Feb 2023 – CFS
- Mar 2023 – CFS
- Apr 2023 – CFS
- May 2023 – CFS
- Jun 2023 – CFS
- Jul 2023 – CFS
- Aug 2023 – CFS
- Sep 2023 – CFS
- Oct 2023 – CFS
- Nov 2023 – CFS
- Dec 2023 – CFS
2022
- Jan 2022 Report – CFS
- Feb 2022 – CFS
- Mar 2022 – CFS
- Apr 2022 – CFS
- May 2022 – CFS
- Jun 2022 – CFS
- Jul 2022 – CFS
- Aug 2022 – CFS
- Sept 2022 – CFS
- Oct 2022 – CFS
- Nov 2022 – CFS
- Dec 2022 – CFS
2021
- Jan 2021 Report – CFS
- Feb 2021 Report – CFS
- Mar 2021 Report – CFS
- Apr 2021 Report – CFS
- May 2021 Report – CFS
- Jun 2021 Report – CFS
- Jul 2021 Report – CFS
- Aug 2021 Report – CFS
- Sep 2021 Report – CFS
- Oct 2021 Report – CFS
- Nov 2021 Report – CFS
- Dec 2021 Report – CFS
2020
Monthly Report Archives
MGD – Millions of gallons per day – 24 hour totals
2016/2017
- Surface Water Diversion by Month, 2016
- Oct 2017 Report – MGD
- Nov 2017 Report – MGD
- Dec 2017 Report – MGD
2018
- Jan 2018 Report – MGD
- Feb 2018 Report – MGD
- Mar 2018 Report – MGD
- Apr 2018 Report – MGD
- May 2018 Report – MGD
- Jun 2018 Report – MGD
- Jul 2018 Report – MGD
- Aug 2018 Report – MGD
- Sep 2018 Report – MGD
- Oct 2018 Report – MGD
- Nov 2018 Report – MGD
- Dec 2018 Report – MGD
2019
CFS – Hourly average flow rate in cubic feet per second (CFS) by month
2017
2018
- Jan 2018 Report – cfs
- Feb 2018 Report – cfs
- Mar 2018 Report – cfs
- Apr 2018 Report – cfs
- May 2018 Report – cfs
- Jun 2018 Report – cfs
- Jul 2018 Report – cfs
- Aug 2018 Report – cfs
- Sep 2018 Report – cfs
- Oct 2018 Report – cfs
- Nov 2018 Report – cfs
- Dec 2018 Report – cfs
2019